Photo kiosk analytics help businesses track customer behavior, transaction details, peak usage, and revenue performance. With the market projected to grow significantly, understanding key metrics is crucial for improving operations and profitability.
Here’s a quick breakdown of the most important metrics:
-
User Engagement Rate: Measures how many interactions lead to completed transactions.
-
Session Duration: Tracks how long customers spend at kiosks to identify usability issues.
-
Photo Print and Download Counts: Highlights popular services to optimize inventory and pricing.
-
Revenue Per Session: Combines data points to assess profitability and upselling opportunities.
Analytics tools, like real-time dashboards, help operators monitor performance, identify trends, and adjust strategies quickly. By focusing on these metrics and using data-driven insights, businesses can improve customer experiences, refine pricing, and boost revenue.
Core Performance Metrics
User Engagement Rate
The user engagement rate measures the percentage of visitors who go from interacting with your kiosk to completing a transaction. It’s a clear way to gauge how well your kiosk turns interest into sales.
To calculate it, divide the number of completed transactions by the total number of interactions, then multiply by 100. For example, if 200 people interact with your kiosk and 60 make a purchase, your engagement rate is 30%.
Interactive kiosks also play a role in boosting social media activity. Research shows a 50% increase in branded booth interactions when kiosks are used.
“Photo booths are great at turning snapshots into shareable content… The resulting images create organic publicity as they circulate online.” – Emma Radebaugh, ArtCentron
Adding features like instant sharing options, branded props, and customizable backgrounds can make your kiosk even more engaging, turning user interest into transactions and social buzz.
Beyond transactions, tracking how long users interact with your kiosk can provide deeper insights into their overall experience.
Session Duration
Session duration measures how much time customers spend interacting with your kiosk. This metric reflects how intuitive and enjoyable the experience is.
While ideal session times vary depending on the kiosk’s purpose, very short sessions might indicate confusion or frustration, while overly long ones could point to navigation issues. Fine-tuning the user interface can help strike the right balance, ensuring a smoother experience that encourages repeat use.
Interestingly, research shows that improving customer retention by just 5% can increase profits by 25% to 95%.
“Satisfied customers are the lifeblood of any successful business. They don’t just buy your products – they become your advocates, champions, and partners in growth. Focus on making them happy, and the profits will naturally follow.” – Jerry Vance
By monitoring session duration, you can identify areas where on-screen instructions or additional support might be needed to keep users engaged and satisfied.
Photo Print and Download Counts
Tracking how often customers print or download photos offers a glimpse into their preferences and helps you refine your services. This data is especially useful for managing supplies and adjusting your offerings to meet demand.
For example, analyzing trends in print and download activity can guide decisions on inventory planning and pricing. Plus, offering a variety of print options can enhance the overall customer experience, making your kiosk more appealing.
Revenue Per Session
Revenue per session connects user engagement and session duration to profitability. By dividing total revenue by the number of completed transactions, you can assess how well your pricing and upselling strategies are performing.
Rather than sticking to fixed benchmarks, use revenue per session as a flexible tool to evaluate pricing strategies over time and across different customer groups. This data can highlight opportunities for dynamic pricing or promotional campaigns, keeping your kiosk competitive and profitable in a changing market.
Analytics Tools and Monitoring
Real-Time Analytics Platforms
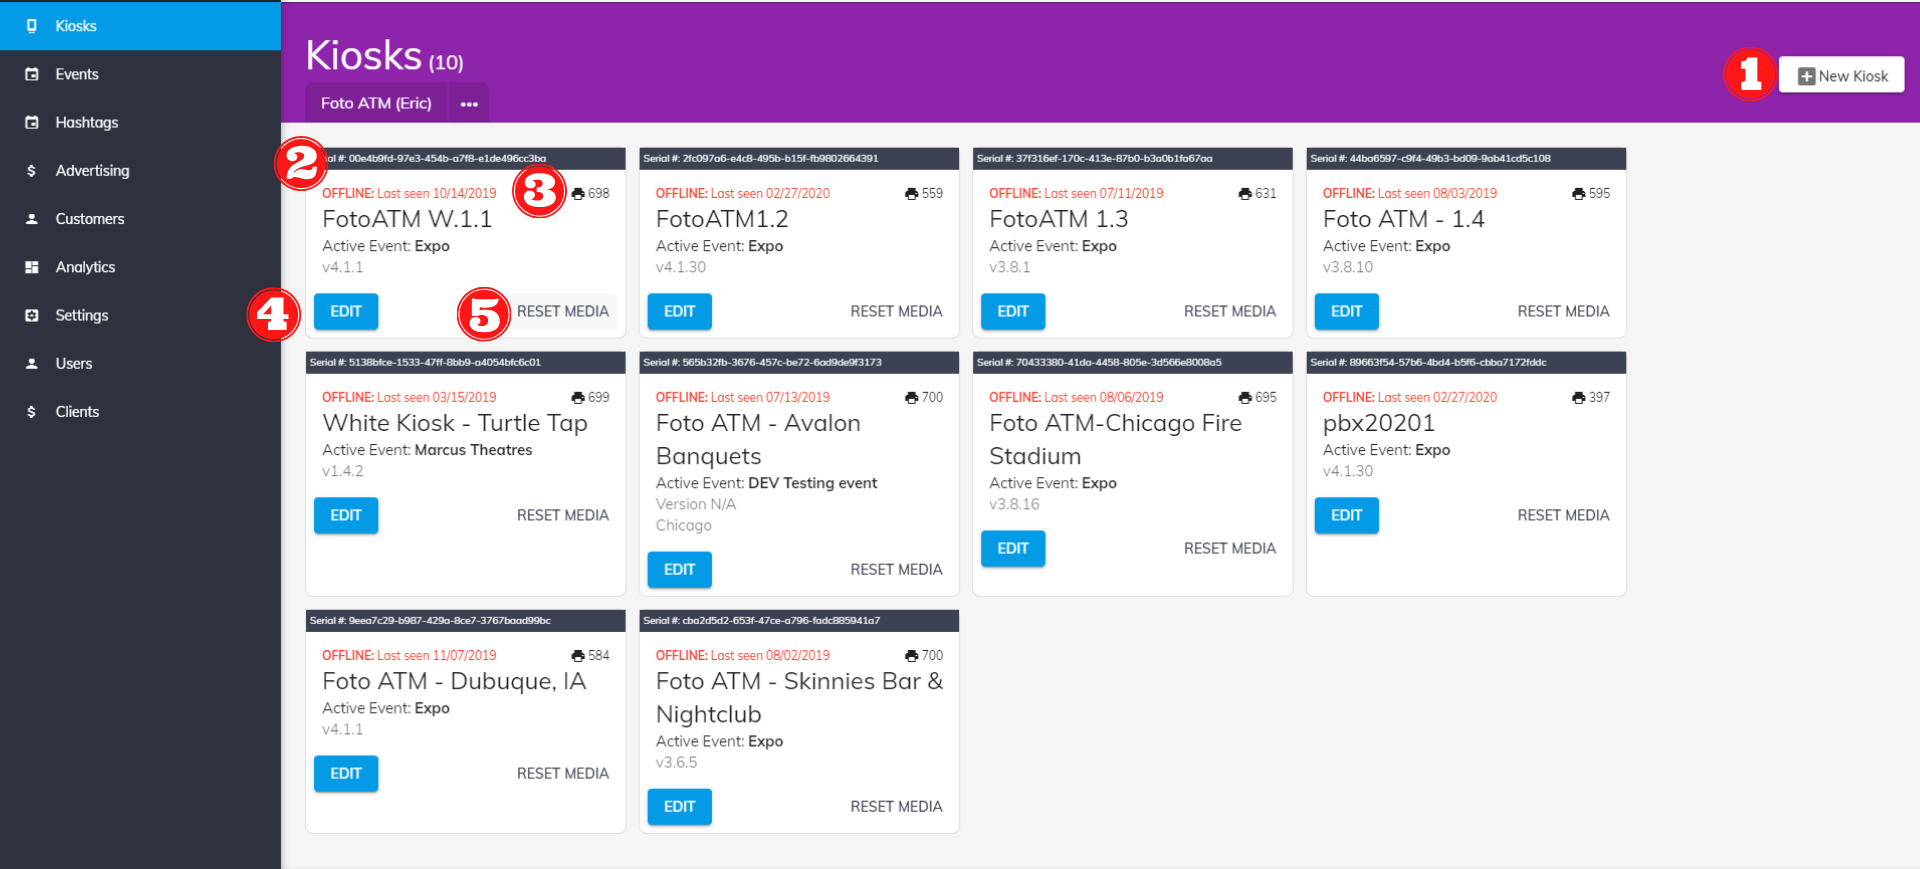
Analytics platforms make it possible for operators to track performance remotely, offering dashboards that highlight critical data points like transaction volumes and user behavior. This kind of visibility helps businesses make informed decisions quickly.
Take the SignifiVISION™ platform, for instance – it handles over 347 million transactions annually and supports more than 2.2 million daily users. This showcases the ability of analytics tools to manage high-volume operations while ensuring reliability.
These platforms also come with features like remote access, customizable dashboards, role-specific displays, and real-time financial integration. Automated alerts via email or SMS notify you when key metrics deviate, enabling fast responses. Role-based dashboards are particularly useful, presenting tailored information for different teams – whether it’s maintenance staff or marketing professionals.
“Quantum Metric provides a single source of truth around our customers’ experience. All stakeholders can easily see and understand the impact of a problem and agree on solutions. Using Quantum Metric has genuinely brought our technology and business teams closer together.” – Steven Teo, Head of Innovations and Digital Controls
In addition to tracking transactions, these tools analyze customer flow, which can significantly improve operational efficiency.
Customer Flow and Peak Usage Analysis
Understanding customer flow and peak usage patterns can refine staffing plans and marketing strategies. Retail foot traffic data reveals how customers navigate spaces, their shopping preferences, and what drives their purchasing decisions. For photo kiosks, such insights help identify peak usage times, address bottlenecks, and optimize kiosk placement.
Peak usage analysis ensures you’re prepared for busy periods by aligning staffing levels and scheduling non-essential tasks during quieter times. The results can be dramatic. For example, Lewiatan saved 861 hours monthly through automation, saw a 140% increase in direction requests, and experienced a 92% boost in website visits. Similarly, New Balance reported a 670.94% increase in driving requests and a 171.85% rise in website visits.
Additional tools like heat maps provide a visual representation of where customers spend the most time and which areas they avoid. These insights can guide decisions on kiosk placement or uncover new revenue opportunities. Dwell time analysis highlights where customers linger, signaling either interest or confusion, while conversion rate tracking helps identify issues like pricing, interface usability, or payment processing hurdles.
Seasonal and promotional analysis offers even more context, showing how factors like weather, local events, or marketing campaigns affect foot traffic. This information is invaluable for planning inventory, staffing, and promotions to maximize effectiveness.
How Can You Measure The Success Of Photo Booths At Events? – Conventions Network
sbb-itb-3201140
Using Data to Improve Kiosk Performance
With real-time analytics and detailed customer behavior data at their fingertips, operators have a powerful tool to enhance kiosk performance. The challenge lies in turning raw data into actionable strategies that drive both revenue growth and customer satisfaction. By setting clear benchmarks, applying targeted strategies, and refining the user experience, businesses can make meaningful improvements.
Setting Benchmarks and Goals
The first step to improving kiosk performance is understanding where you currently stand. Kiosk management software offers insights into usage patterns, transaction completion rates, and common roadblocks. This data serves as the foundation for setting realistic and measurable improvement goals.
Dive into daily, weekly, and monthly session data to establish baseline metrics. From there, focus on specific objectives like increasing usage, shortening transaction times, or reducing drop-off rates. Use dashboards to filter data by organization, venue, kiosk, or time period to identify trends and pinpoint underperforming locations in need of attention.
For example, the photo printing kiosk market is projected to hit $2,183.44 million by 2030, growing at a CAGR of 1.7%. In 2022, North America accounted for 36.80% of the market share. These figures underline the importance of setting ambitious yet achievable benchmarks to stay competitive and capture market opportunities.
Once benchmarks are in place, the next step is implementing strategies that directly impact revenue.
Revenue Optimization Strategies
Armed with benchmarks, operators can use analytics to uncover ways to increase revenue per session. Session duration is a key indicator of user engagement – longer sessions often translate to higher satisfaction and spending. By segmenting users based on engagement levels, you can tailor strategies to different customer groups.
For instance, performance tools have been shown to boost customer satisfaction by 10–15% and increase repeat business by 15%. Dynamic pricing is another effective approach: adjusting prices based on peak hours can maximize revenue during busy periods, while offering discounts during slower times encourages more consistent usage. Well-optimized marketing campaigns can deliver impressive returns, with some achieving over 200% ROI.
Retention campaigns are also critical. For users with shorter session durations, offer incentives to return, such as discounts or free upgrades. Meanwhile, reward highly engaged users with premium features or bulk order discounts to maintain their loyalty.
The broader photo booth kiosk market offers even more potential, with a value of $3.96 billion in 2023 expected to grow to $9.16 billion by 2032 at a CAGR of 9.79%. Staying ahead of market trends by leveraging analytics ensures operators can tap into this growing demand.
Improving Customer Experience
Enhancing the customer experience is where data truly shines. By analyzing session duration, operators can identify high-value users and focus on retention strategies tailored to their needs.
Pinpoint and resolve interface issues – like payment or form submission problems – using drop-off analytics. Simplify on-screen instructions and reduce unnecessary transaction steps to make the process smoother. Regularly monitoring kiosk uptime is also essential to maintain customer trust and prevent disruptions.
Interestingly, stores offering regular classes or events see repeat customer rates rise by up to 20%. While this insight comes from traditional retail, the concept applies to kiosks too. Offering engaging or educational content can encourage users to return.
Personalization is another game-changer. Use data to highlight popular photo sizes or formats at specific locations, tailoring the interface to match user preferences. Gamification techniques – like challenges and rewards – can further boost engagement and session duration.
Finally, gather customer feedback through surveys or staff interactions. Combine this qualitative input with quantitative data to get a well-rounded view of user needs. Address common complaints and adjust your strategies accordingly. Regularly reviewing session duration data ensures your efforts remain aligned with customer expectations.
Best Practices for U.S. Operators
Running photo kiosks in the U.S. means following local standards and compliance protocols to ensure your analytics are accurate and actionable. These practices form the backbone of reliable performance metrics.
Reporting and Compliance
Data privacy and security are non-negotiable for kiosk compliance. If your photo kiosk collects personal information or interacts with federal systems, you must follow the NIST Special Publication 800-63A guidelines. These guidelines outline identity assurance levels, ranging from IAL1 (no identity linking required) to IAL3 (requiring physical presence).
For kiosks offering visa photo services, meeting the U.S. Department of State’s strict requirements is crucial. Visa photos must adhere to specific standards, including guidelines on size, color, background, and facial expressions.
If your kiosk provides printing services, maintaining consistent quality is key. Following ISO standards for the printing industry – covering process control, color management, digital workflows, and quality checks – ensures reliable output and offers measurable benchmarks for your analytics.
Additionally, if your operation involves union employees, ensure compliance with the Labor-Management Reporting and Disclosure Act (LMRDA) by submitting the necessary reports.
Once compliance protocols are in place, standardizing data presentation to match U.S. conventions will further improve clarity and operational insights.
U.S. Units and Formatting
To align with U.S. standards, make sure your analytics dashboard uses the following formats:
-
Currency Formatting: Display monetary values using the $#,##0.00 format. For example, show revenue as $2,847.93 instead of 2847.93.
-
Date Formatting: Use the MM/DD/YYYY format, such as 06/15/2025, to avoid confusion in time-sensitive data.
-
Number Formatting: Separate thousands with commas and use periods for decimals (e.g., 1,247 users). Clearly present percentages, like 23.5% engagement rate.
-
Temperature Readings: Use Fahrenheit for temperature (e.g., 75°F), especially for maintenance-related data.
-
Physical Measurements: Stick to imperial units for measurements, such as paper sizes (4” x 6”, 5” x 7”, 8” x 10”) and weights in pounds and ounces.
-
Language Consistency: Follow American English spelling conventions, such as “color”, “analyze”, and “optimize”, for a polished, professional look.
-
Time Zones: Specify whether timestamps reflect local time or a standardized zone like Eastern Time. For multi-location setups, consider showing both local and Eastern Time.
-
Data Standardization Tools: Leverage tools like built-in formatting options in Google Sheets to maintain consistent data presentation.
Conclusion
Photo kiosk analytics serve as a guide to achieving steady growth and profitability. By monitoring user engagement rates, session durations, photo print and download counts, and revenue per session, operators can gain valuable insights to make smarter business decisions.
Research shows that data-driven decision-making can improve productivity by 4% and increase profits by 6%. Yet, 61% of leaders still rely on gut instincts instead of fully analyzing available data. This gap presents a huge opportunity for photo kiosk operators who embrace analytics.
“By leveraging the wealth of digital insights available at your fingertips and embracing the power of business intelligence, you can make informed decisions with confidence – the kind that will lead to commercial growth, evolution, and a healthier bottom line.”
Ignoring data has caused 97% of leaders to miss out on revenue opportunities and make poor investment choices. For photo kiosk businesses, this can lead to losing customers, ineffective pricing strategies, and missed chances for expansion. These statistics underline the importance of making every customer interaction count.
To stay ahead, implement reliable data systems, set clear benchmarks, and regularly analyze performance metrics. Whether it’s refining kiosk placement, adjusting pricing strategies, or enhancing the user experience, let data guide your decisions.
FAQs
How can tracking session duration help photo kiosk operators improve customer experience and retention?
Tracking how long users spend during a session can reveal a lot about their experience with your photo kiosk. If sessions are longer, it often means users are more engaged and enjoying the process. By digging into this data, you can figure out which features users love and spot areas that could use a little tweaking.
For instance, if you notice people tend to leave right after a certain step, it might be worth simplifying or improving that part of the process. Making these adjustments can help keep users around longer. Over time, these small changes can boost customer satisfaction, build loyalty, and encourage more repeat visits.
How can I increase the revenue per session for my photo kiosk?
To increase revenue per session, think about offering extras like custom props, themed backdrops, or instant photo-sharing options. These small upgrades can entice customers to spend a little more during their visit. You could also roll out premium packages that include perks like personalized branding or high-quality prints – perfect for those looking for a standout experience.
Another idea? Promote limited-time deals or discounts on bundled services to encourage bigger purchases. You can also boost earnings by offering digital downloads or encouraging customers to share their photos on social media, which might lead to additional sales after the session. By mixing and matching these approaches, you’ll not only increase your revenue but also leave customers feeling more satisfied with their experience.
How can real-time analytics improve the efficiency of photo kiosks?
Real-time analytics bring a new level of efficiency to photo kiosks by providing instant insights into how customers interact with them and how transactions unfold. These insights empower operators to make quick adjustments, such as fine-tuning staffing levels, cutting down wait times, or tailoring promotions to align with current customer trends.
By tracking important metrics like session duration, engagement rates, and revenue per session, operators can create better customer experiences while driving sales. The ability to act on real-time data also means faster responses to operational challenges or market shifts, which not only helps improve profitability but also simplifies overall kiosk management.
Ready to add passive revenue to your venue? Take the 60-second kiosk quiz to find your perfect match, or compare all models side by side.